Generated Reports

Purchase Orders Report

We can easily understand all the Purchase Orders by graphical representation. By searching with various dates,it shows the Purchase Orders on respective date only by giving the type of Purchase Orders like created, entry dates.

Go to Generated Reports–>Click on Purchase Orders Reports.

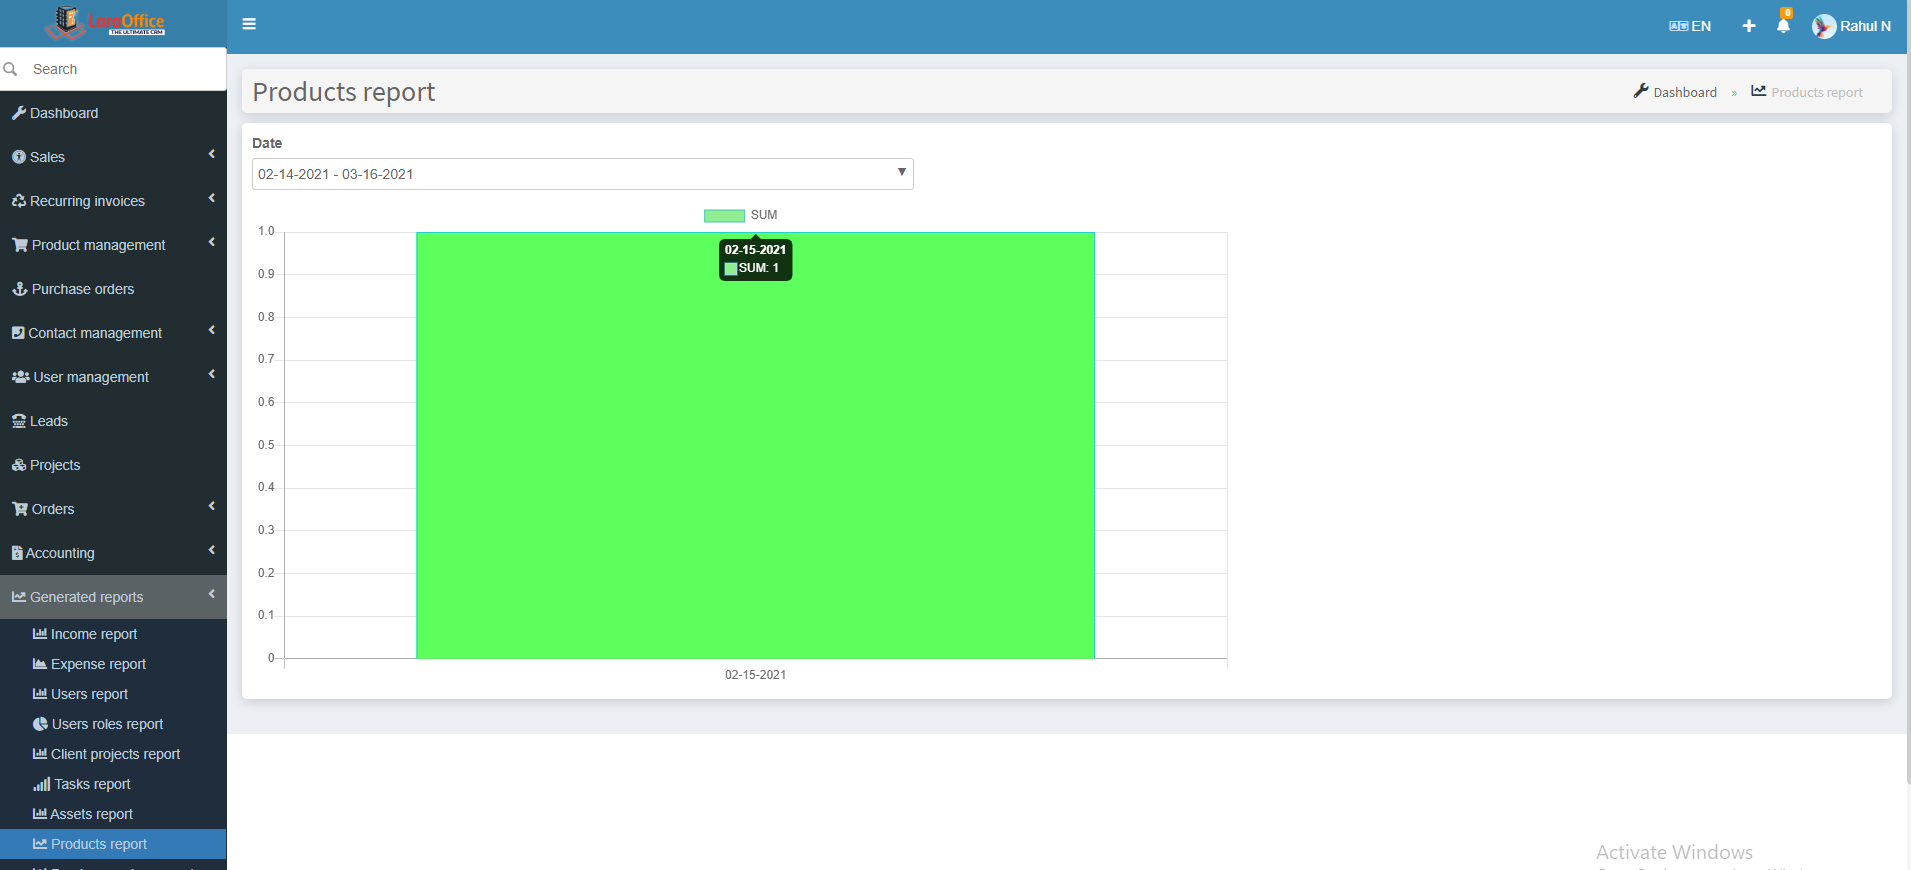
  • Date Range –Set the date range to know this report analysis including the information about it.
  • Type – Only display Incomes in a specific type

In X-axis, it shows the date fields.

In Y-axis, it shows the number of Purchase Orders.

Related Articles

Products Report

We can easily understand all the Products by graphical representation by searching with various dates it shows the Products on respective date.

Go to Generated Reports–>Click on Products Reports.

  • Date Range – You can set a date range you would like to know this report to include the information about it.

In X-axis, it shows the date fields.

In Y-axis, it shows the number of Products.

Related Articles

Assets Report

We can easily understand all the AssetsManagament by graphical representation by searching with various dates it shows the Assets on the respective date.

Go to Generated Reports–>Click on Assets Reports.

  • Date Range – You can set a date range you would like to know this report to include the information about it.

In X-axis, it shows the date fields.

In Y-axis, it shows the number of assets.

Related Articles

Tasks Report

We can easily understand all the tasks by graphical representation by searching with various dates it shows the tasks on the respective date.

Go to Generated Reports–>Click on Tasks Reports.

  • Date Range – You can set a date range you would like to know this report to include the information about it.

In X-axis, it shows the date fields.

In Y-axis, it shows the number of tasks.

Related Articles

Users Report

We can easily understand all the Users who are joined in a system by graphical model by searching with various dates to know the Users who are joined on respective dates.

Go to Generated Reports–>Click on Users Reports.

  • Date Range – You can set a date range you would like to know this report to include information about it.

In X-axis, it shows the date fields.

In Y-axis, it shows the number of persons are joined.

Related Articles