We can easily understand all the Users who are joined in a system by graphical model by searching with various dates to know the Users who are joined on respective dates.
Go to Generated Reports–>Click on Users Reports.
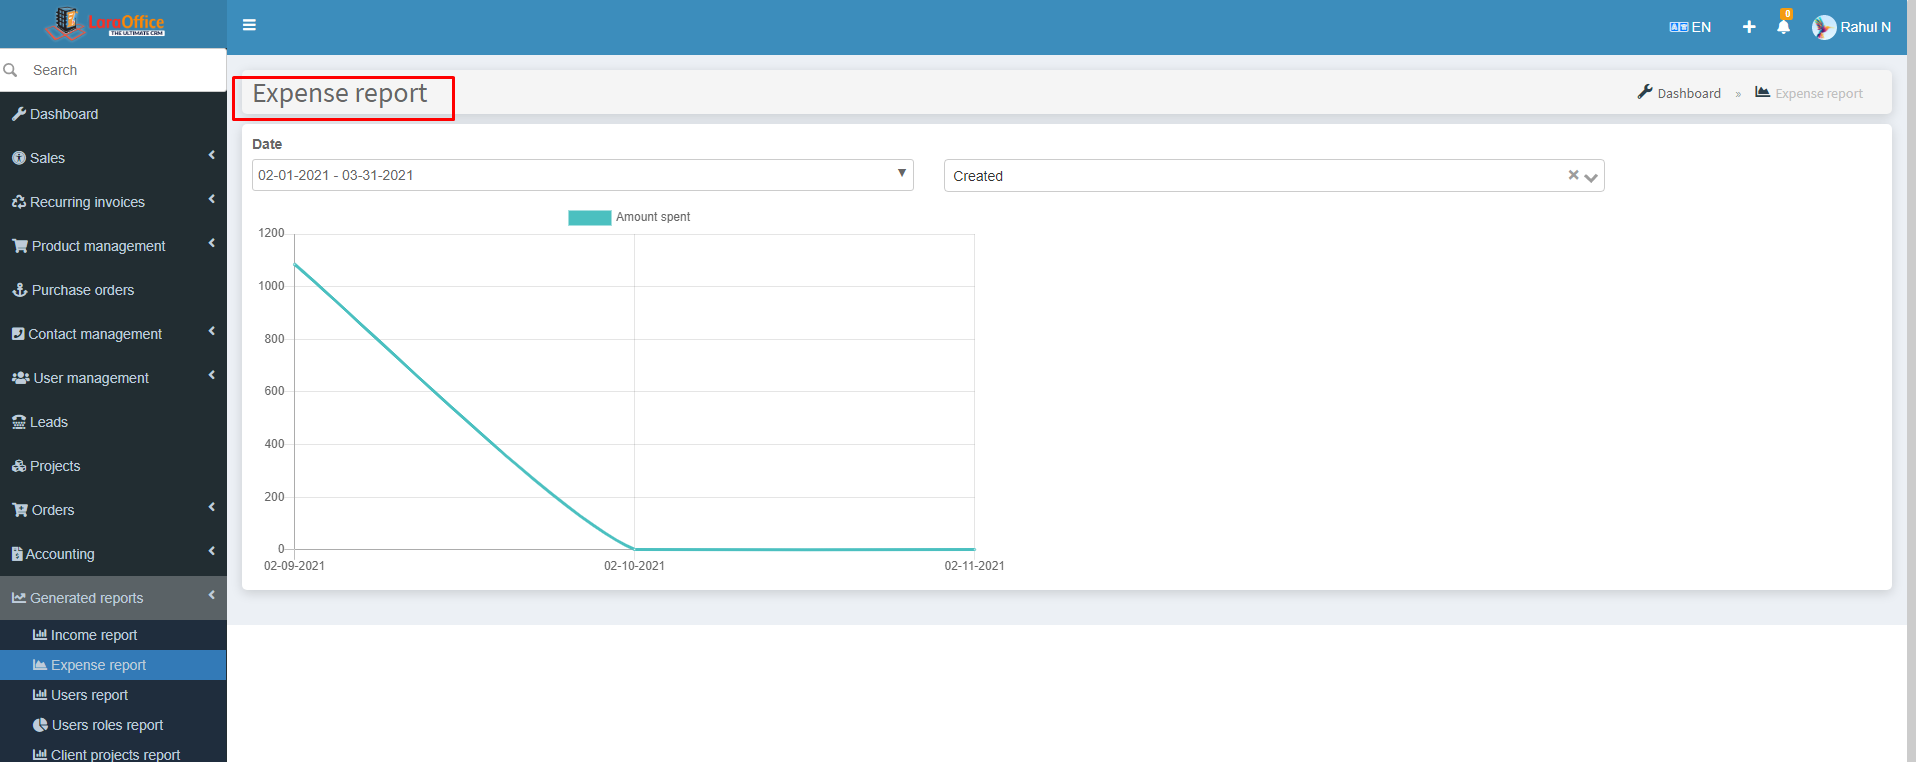
- Date Range – You can set a date range you would like to know this report to include information about it.
 In X-axis, it shows the date fields.
In Y-axis, it shows the number of persons are joined.
 In X-axis, it shows the date fields.